Employment
All cards are clickable for more information, except those related to work completed at Reyes Coca-Cola Bottling.
ML Engineer: Reyes Coca Cola Bottling
Merchandiser Routing App
Business Problem: Merchandisers travel to stores to ensure delivered products reach shelves. Routing was manual and did not account for stocking time per store or drive times, leading to inefficiencies.
Solution: Developed a web app for building optimized routes from scratch. The tool displays nearby stores using ESRI’s distance matrix and calculates total route time by combining drive time with in-store stocking time. An ML model estimates stocking time based on factors like delivery volume, product mix, day of week, and visit frequency.
Value Added: Reduced manual rerouting effort by 70% and improved efficiency of merchandiser scheduling.
Summer 2025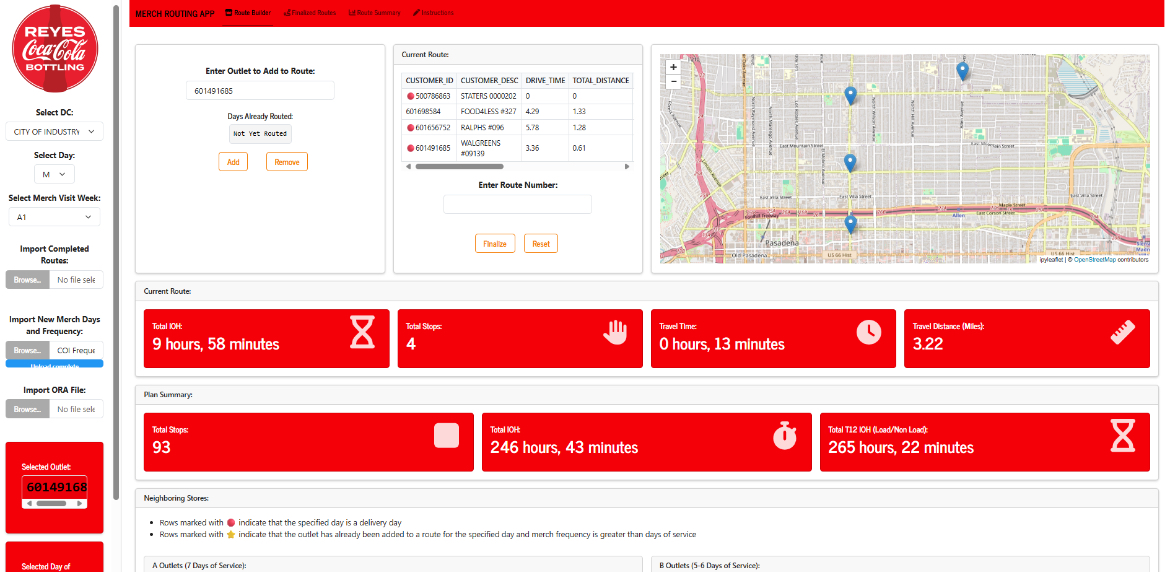
Nielsen Category Forecasting
Business Problem: While we already forecast our own internal sales, we lacked visibility into total category trends including competitor products. Understanding category growth (e.g., health/nutrition drinks) is critical for making informed negotiations on shelf and display space.
Solution: Evaluated multiple forecasting approaches and selected Facebook Prophet for its speed and retraining efficiency. Trained over 4,000 models using Nielsen data to produce 26-week forecasts by category and key account. Deployed via Docker and Azure Container Registry with an automated pipeline that ingests new data weekly, detects model drift, and retrains as needed. Results are stored in Snowflake and visualized through a PyShiny web app with accuracy metrics and interactive category/account selection.
Value Added: Provides the space team with robust market insights for shelf negotiations. For example, at Stater Bros (168 outlets), forecasts demonstrated stronger SSD (sparkling soft drink) trends, which helped secure commitments to maintain or increase SSD shelf space during major remodels.
User Feedback: “This achievement would not have been possible without the dedication and expertise of our data science team and Tyler’s outstanding contributions. Their work not only influenced one of our largest accounts but also set a precedent for how we can use analytics to drive strategic outcomes.”
Summer 2025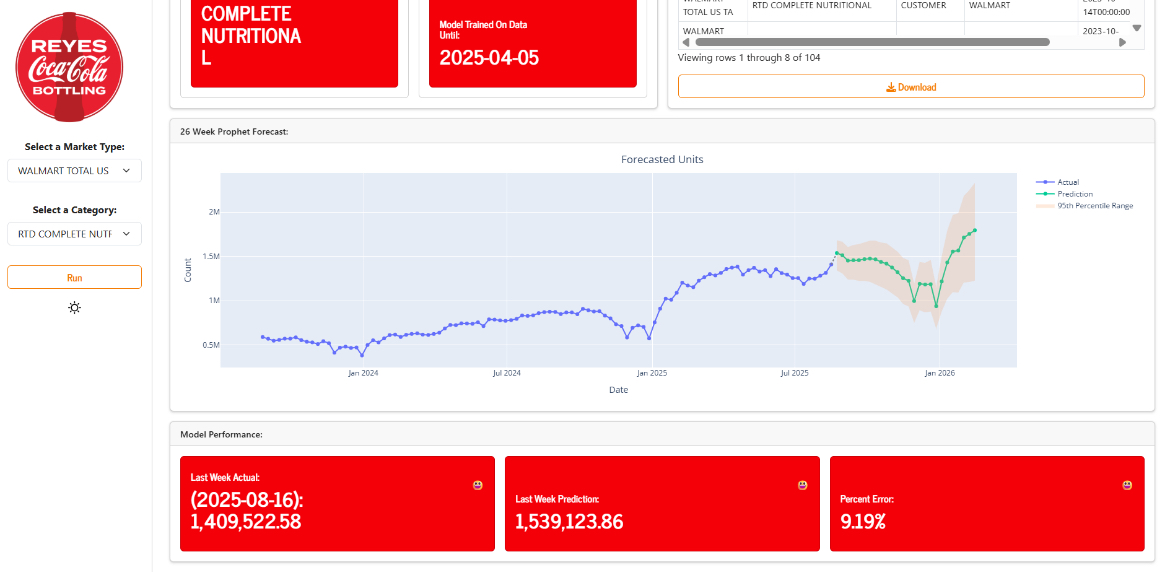
ASRS Dashboard
Business Problem: A facility with an Automated Storage and Retrieval System (ASRS) lacked visibility into what was stored, upcoming expirations, and category-level capacity needs, making it difficult to plan production effectively.
Solution: Built a web app that ingests Excel exports from the ASRS system and visualizes storage capacity, highlights low/high inventory products, and flags items nearing expiration.
Value Added: Enabled the production team to make proactive, data-driven decisions on what to produce next, improving efficiency and reducing waste.
Spring 2025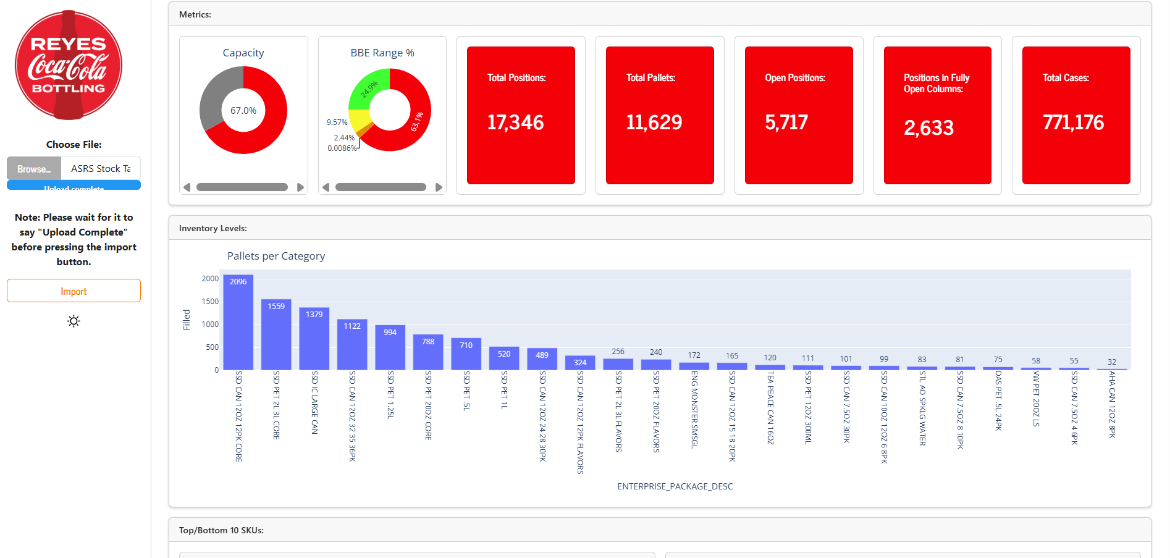
Reactive Technician Planning
Business Problem: Field technicians often spend excessive time idle while waiting for service calls (e.g., coolers, Freestyle machines). We needed a way to forecast weekly maintenance requests to better schedule staffing and reduce downtime.
Solution: Built a series of LSTM models in TensorFlow, each predicting one additional day ahead, to generate a full 7-day forecast. Models run every Sunday, with results visualized through a PyShiny web app for easy planning.
Value Added: Proof of concept at the Los Angeles distribution center demonstrated potential to reduce technician idle time and labor costs. Deployment across the company is in progress.
Winter 2024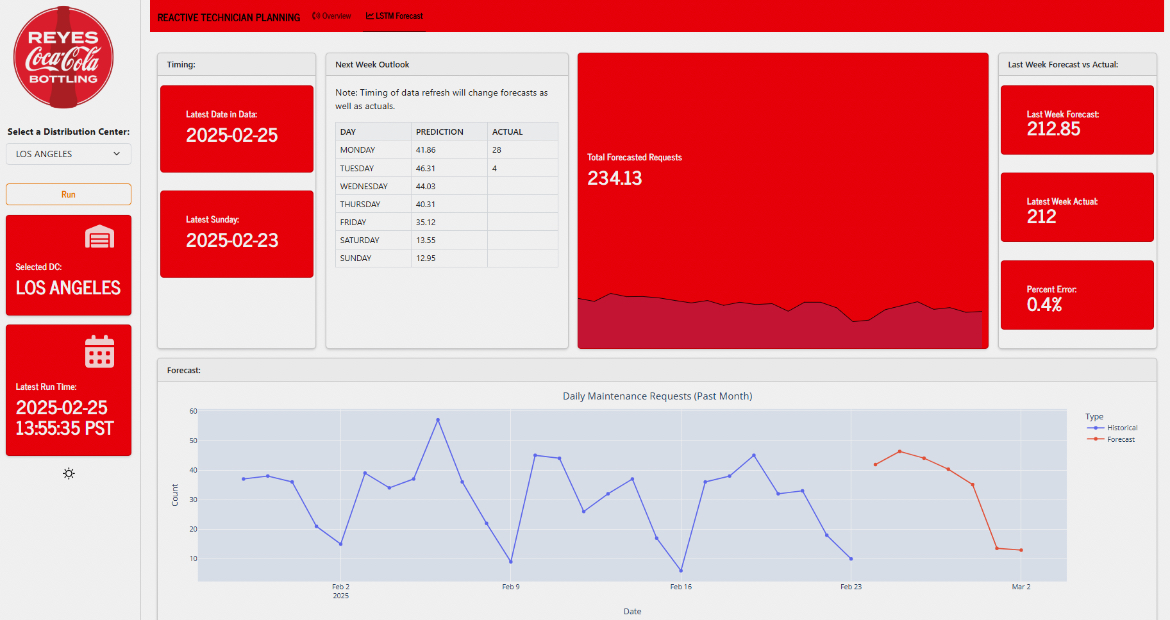
Dock Door Optimization App
Business Problem: Warehouse supervisors were manually assigning delivery routes to dock doors, often arbitrarily. In large facilities, poor assignments could add hundreds of feet of unnecessary travel for pallet jacks, increasing inefficiency and equipment wear.
Solution: Built an optimization algorithm that combines distances from pick floor aisles to dock doors with order details to recommend the most efficient dock door assignments. Delivered via a web app that enables real-time, daily optimization of truck-to-door assignments.
Value Added: Piloted at the Milwaukee facility, reducing travel distance for pallet jacks, improving efficiency, and extending equipment longevity.
Fall 2024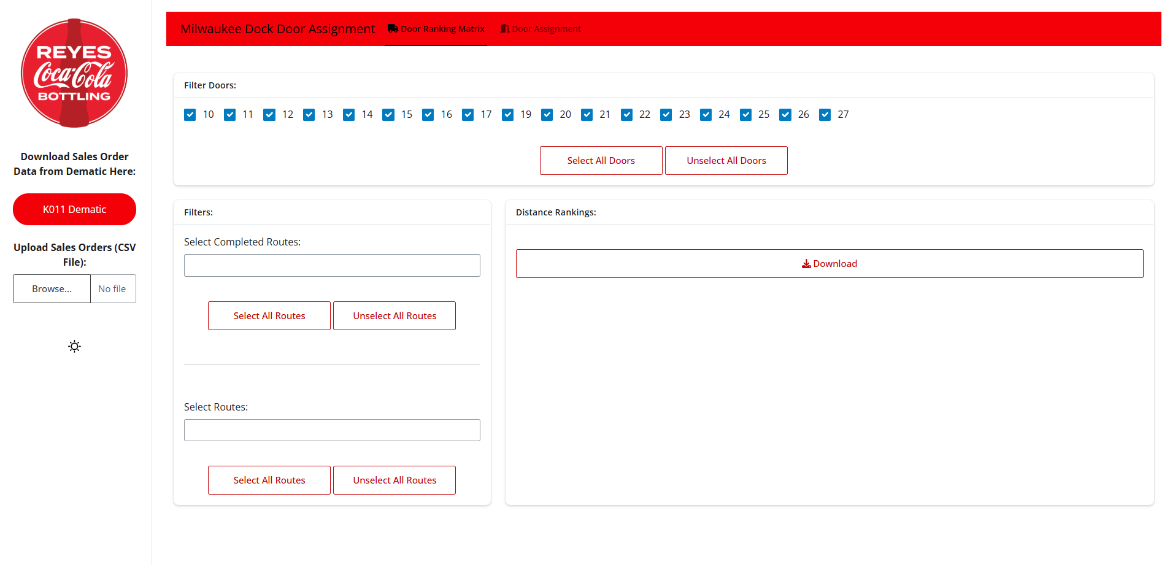
Junior Data Scientist: Reyes Coca Cola Bottling
Image Rec Coaching Tool
Business Problem: Sales reps capture over 200k display photos monthly, which are sent to Maxerience for product recognition. Poor-quality images (angled, compressed, blurry) reduce accuracy, leading to unreliable display data.
Solution: Fine-tuned a vision transformer to classify images as "good," "angled," or "compressed." Deployed a pipeline scoring 8–15k images daily, with results fed into a dashboard linking low-quality photos to specific reps. Managers use this to coach reps, and incentives reward territories with high-quality images.
Value Added: Significantly improves accuracy of display recognition, ensuring more reliable insights for sales and merchandising.
Summer 2024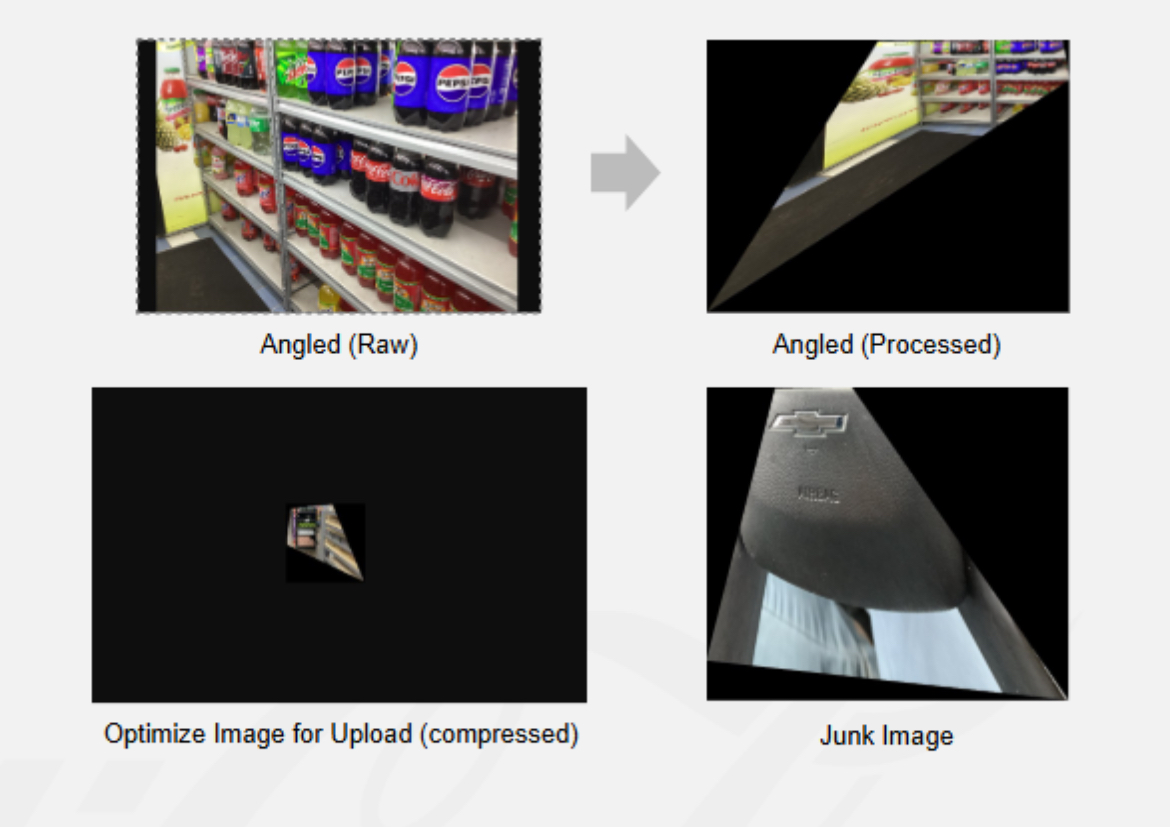
Data Science Team Homepage
Business Problem: As a legacy industry, many employees lacked awareness of the data science team’s capabilities, limiting effective collaboration and meaningful project requests.
Solution: Created a web application showcasing our mission statement and highlighting completed projects to demonstrate the team’s value and expertise.
Value Added: Increased visibility of the data science team’s impact and fostered stronger engagement across the organization.
Fall 2023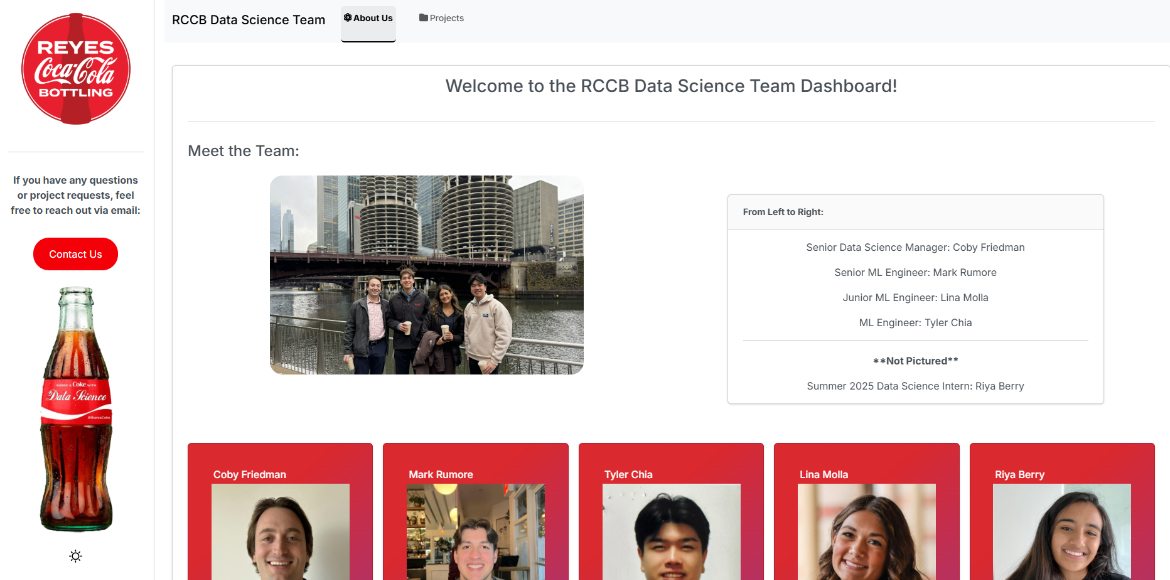
Credit Limit Analysis
Business Problem: Company credit card limits were inconsistent, with too many unique tiers. This created unnecessary liability while making it difficult to standardize limits without reducing employee flexibility.
Solution: Applied unsupervised machine learning to define 10 optimal credit limit tiers based on max monthly spend (+20% buffer). Developed a process to assign new card limits by matching employee attributes (e.g., department, location, direct reports) to similar employees, then using their average spend to determine the appropriate tier. Successfully scaled the same approach for a sister company (Reyes Beverage Group).
Value Added: Reduced decision time for assigning new card limits, standardized tiers, and cut monthly liability by $1.49M with zero limit extensions. At Reyes Beverage Group, achieved an additional $914K reduction in liability.
Fall 2023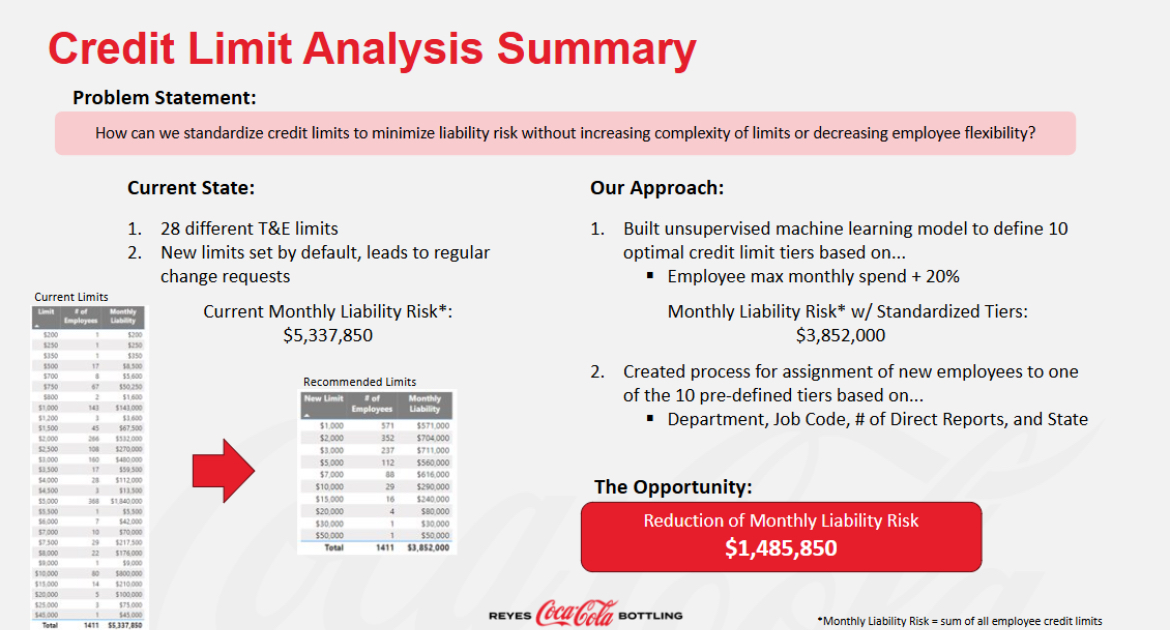
Holiday Planning
Business Problem: Holiday weeks reduce the number of delivery days, forcing planners to manually shift and cut delivery stops, a time-consuming and stressful process.
Solution: Built a data-driven recommendation engine that automates the first pass of delivery cuts and schedule shifts during 4-day work weeks.
Value Added: Saved ~2,300 hours of manual planning annually and improved decision quality by making cuts fully data-driven.
Summer 2023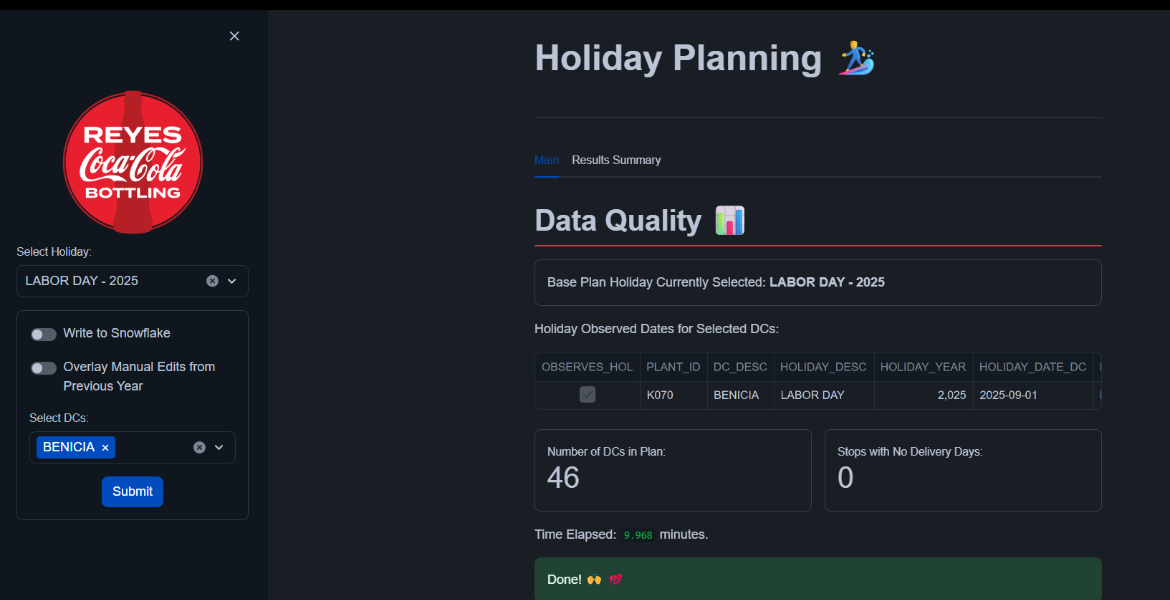
PDF POG Data Scraping
Business Problem: The space team receives 800+ Walmart PDF planograms annually, each with shelf diagrams and supporting data. Extracting this information manually or with third-party tools was slow and still required significant cleanup.
Solution: Developed a Flask-based tool that processes a folder of PDFs and outputs the extracted data into ready-to-use Excel files compatible with the team’s software.
Value Added: Automated data extraction saved the team 1,600+ hours annually, freeing time for higher-value analysis of display configurations.
Spring 2023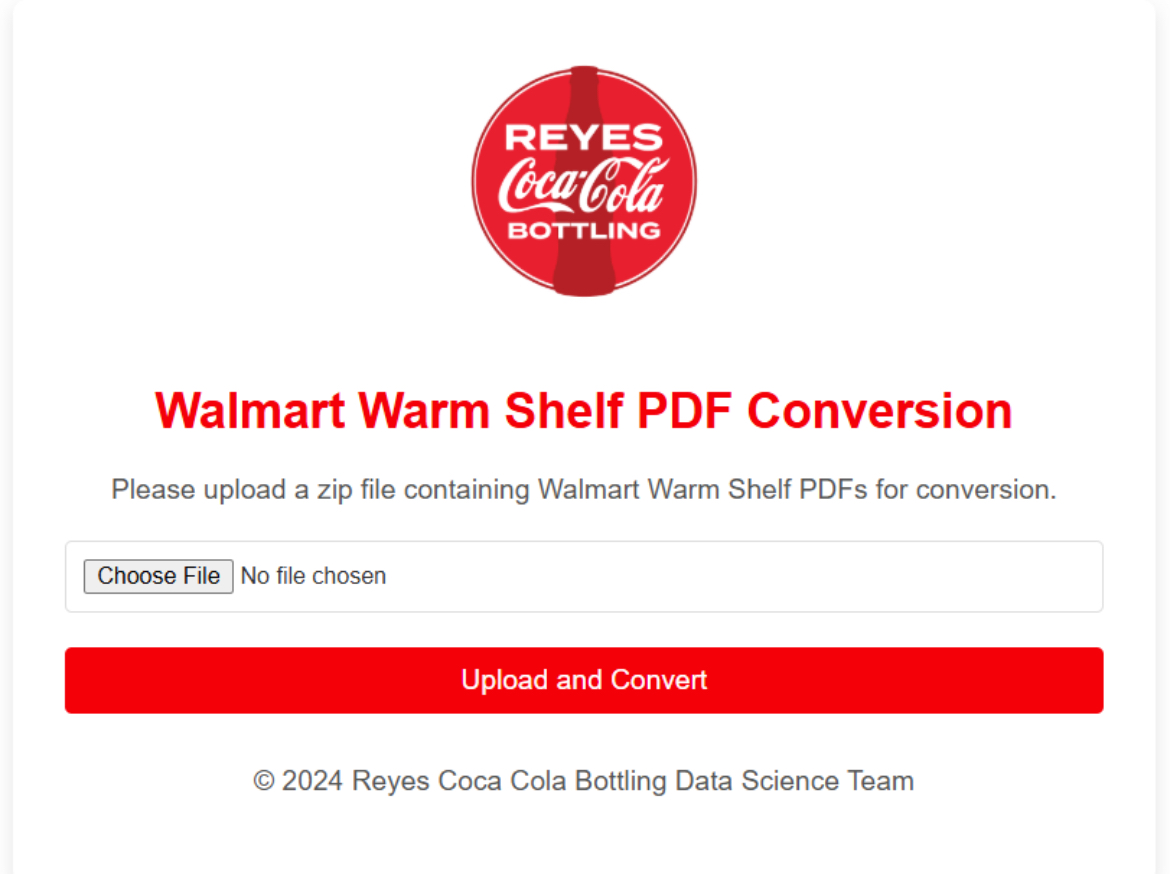
Warehouse Slotting
Business Problem: How can we optimize product placement on the warehouse pick floor while accounting for building constraints, pick flow, volume, stability, and allergens?
Solution: Designed a custom algorithm leveraging market basket analysis (Apriori) combined with operational constraints. Delivered as a Streamlit web app that accepts a building layout as input and generates an optimized pick floor arrangement.
Value Added: Reduced layout creation time by 4–5x compared to manual methods. Achieved 5–15% improvement in Cases Per Hour, along with fewer out-of-stocks and reduced product breakage.
Winter 2022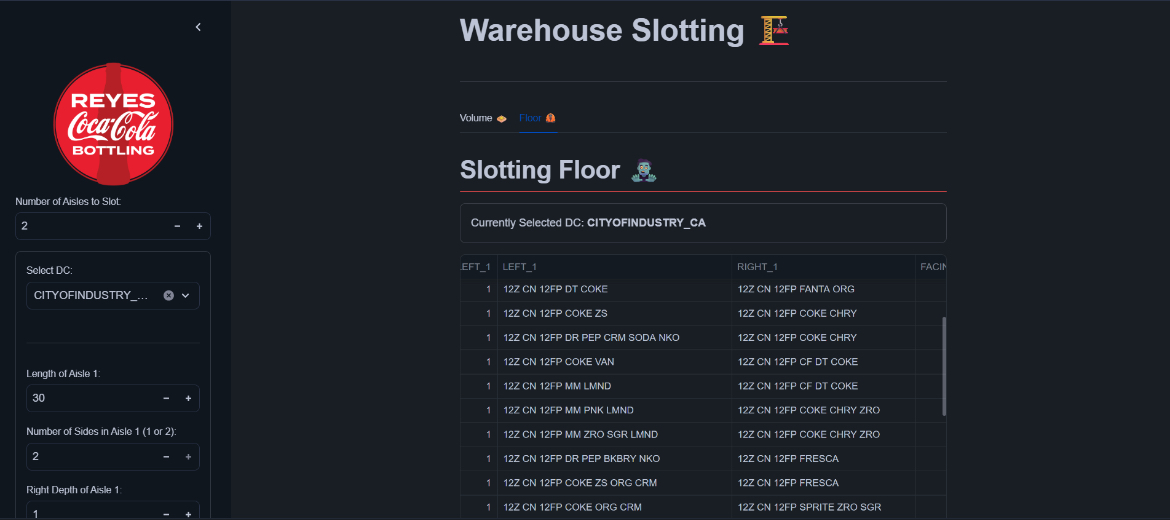
Data Science Intern: Reyes Coca Cola Bottling
Surveyor Routing
Business Problem: Surveyors are employees that are tasked with going to stores and taking images of products on shelves and in coolers to ensure the right products are on display. How can we route them in an efficient manner?
Solution: Implemented an agglomerative clustering algorithm along with business logic to create optimal driving routes. Finished product in the form of an Alteryx workflow handed off to the sales ops team.
Value Added: Saved sales operations team 20 hours of manual route building labor every month.
Fall 2022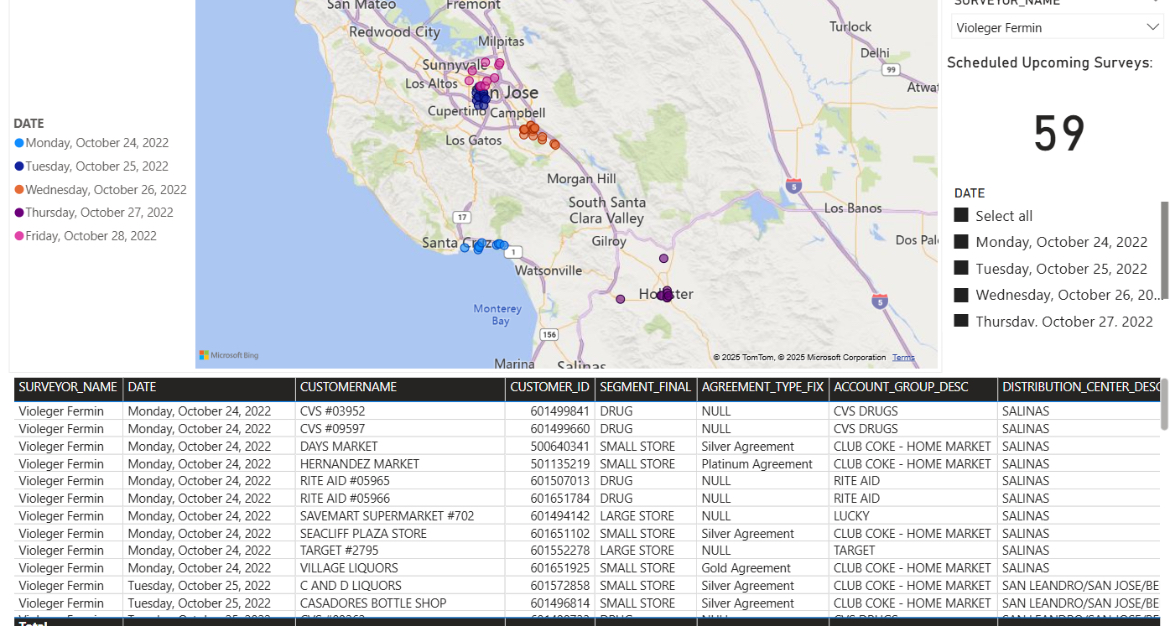
FSOP Customer Segmentation
Business Problem: FSOP (Food Service on Premise) customers such as hospitals, universities, and quick-service restaurants—vary in profitability. We knew revenue and costs, but needed to understand what makes a customer profitable and how to group them effectively.
Solution: Applied K-means clustering on customer characteristics. Found profitability was strongly tied to product mix. For example, hospitals tended to order high volumes of sports drinks (Powerade, Bodyarmor), which carry higher margins. Results were visualized in a Power BI dashboard.
Value Added: Gave account managers clearer insight into customer behavior guiding product mix and shelf space negotiations. Provided the data science team with new feature for future models.
Summer 2022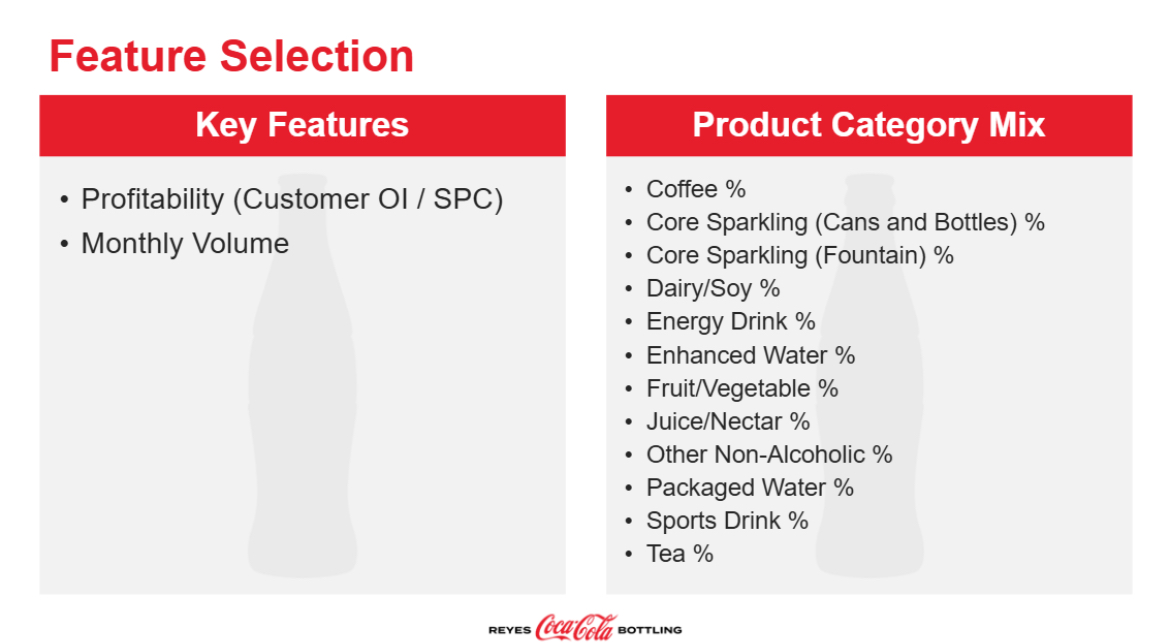
NSF Data Science Fellowship
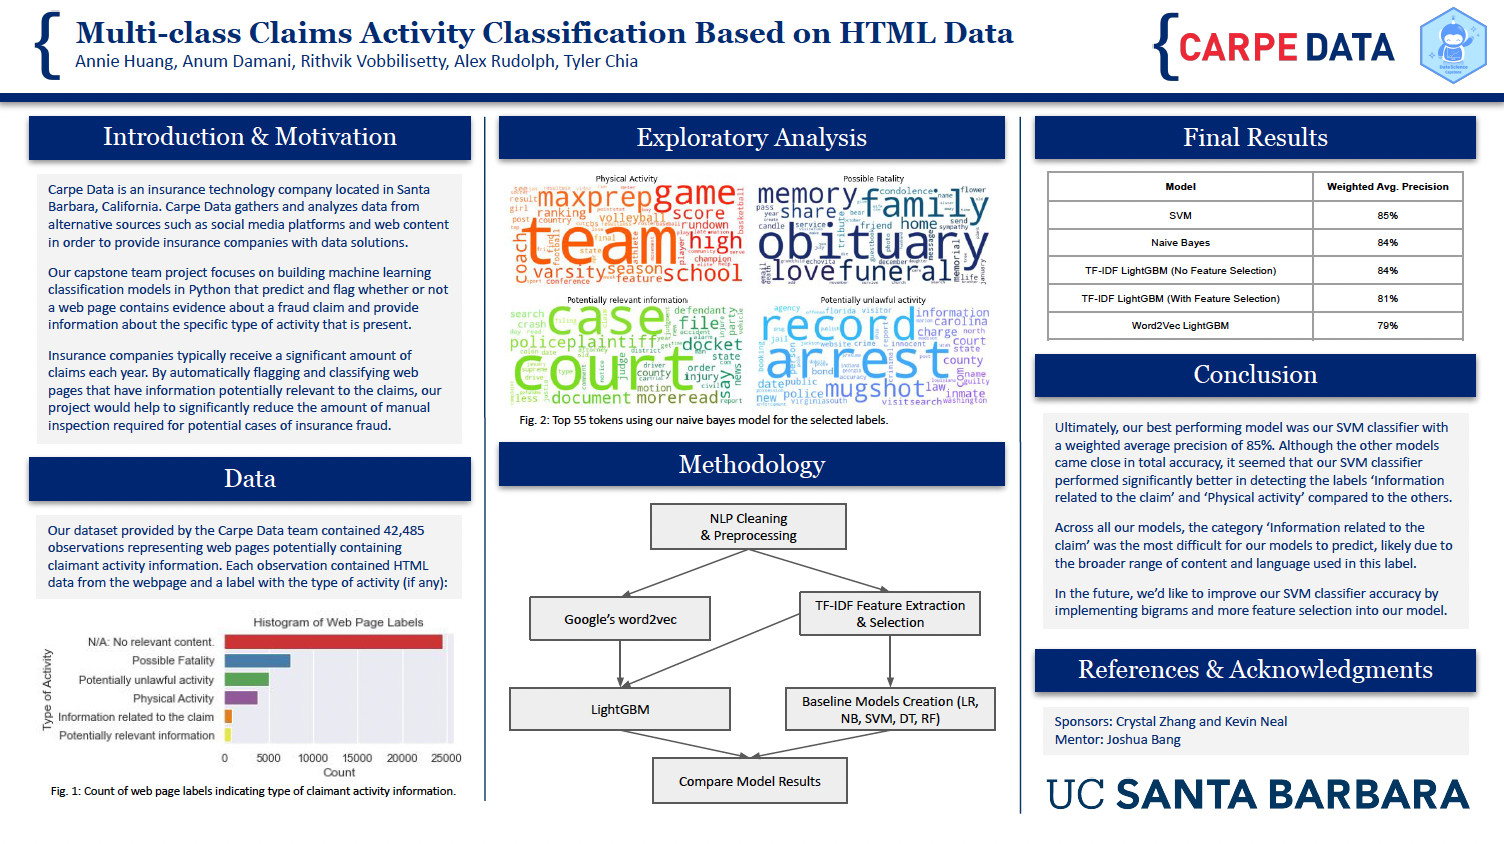
Fraud Classification
As a data science fellow for the Central Coast Data Science Partnership, during my winter and spring quarters of my fourth year at UCSB, I was tasked with working with sponsoring company, Carpe Data, in building an insurance fraud classifying model.
- Carpe Data is an insurance technology company whose headquarters is located in Santa Barbara, California. Carpe Data gathers and analyzes data from sources such as social media platforms and web content in order to provide insurance companies with data solutions. Insurance companies typically receive a significant amount of claims each year; Carpe Data helps to reduce the amount of manual inspection needed to verify these claims through the use of their algorithms.
- Our capstone team’s project focuses on building machine learning models in Python that predict whether or not a web page contains evidence about a fraud claim and provide information about the specific type of fraudulent activity that is present.
- Project poster can be seen here
Data Analytics Intern: UCSB Baseball
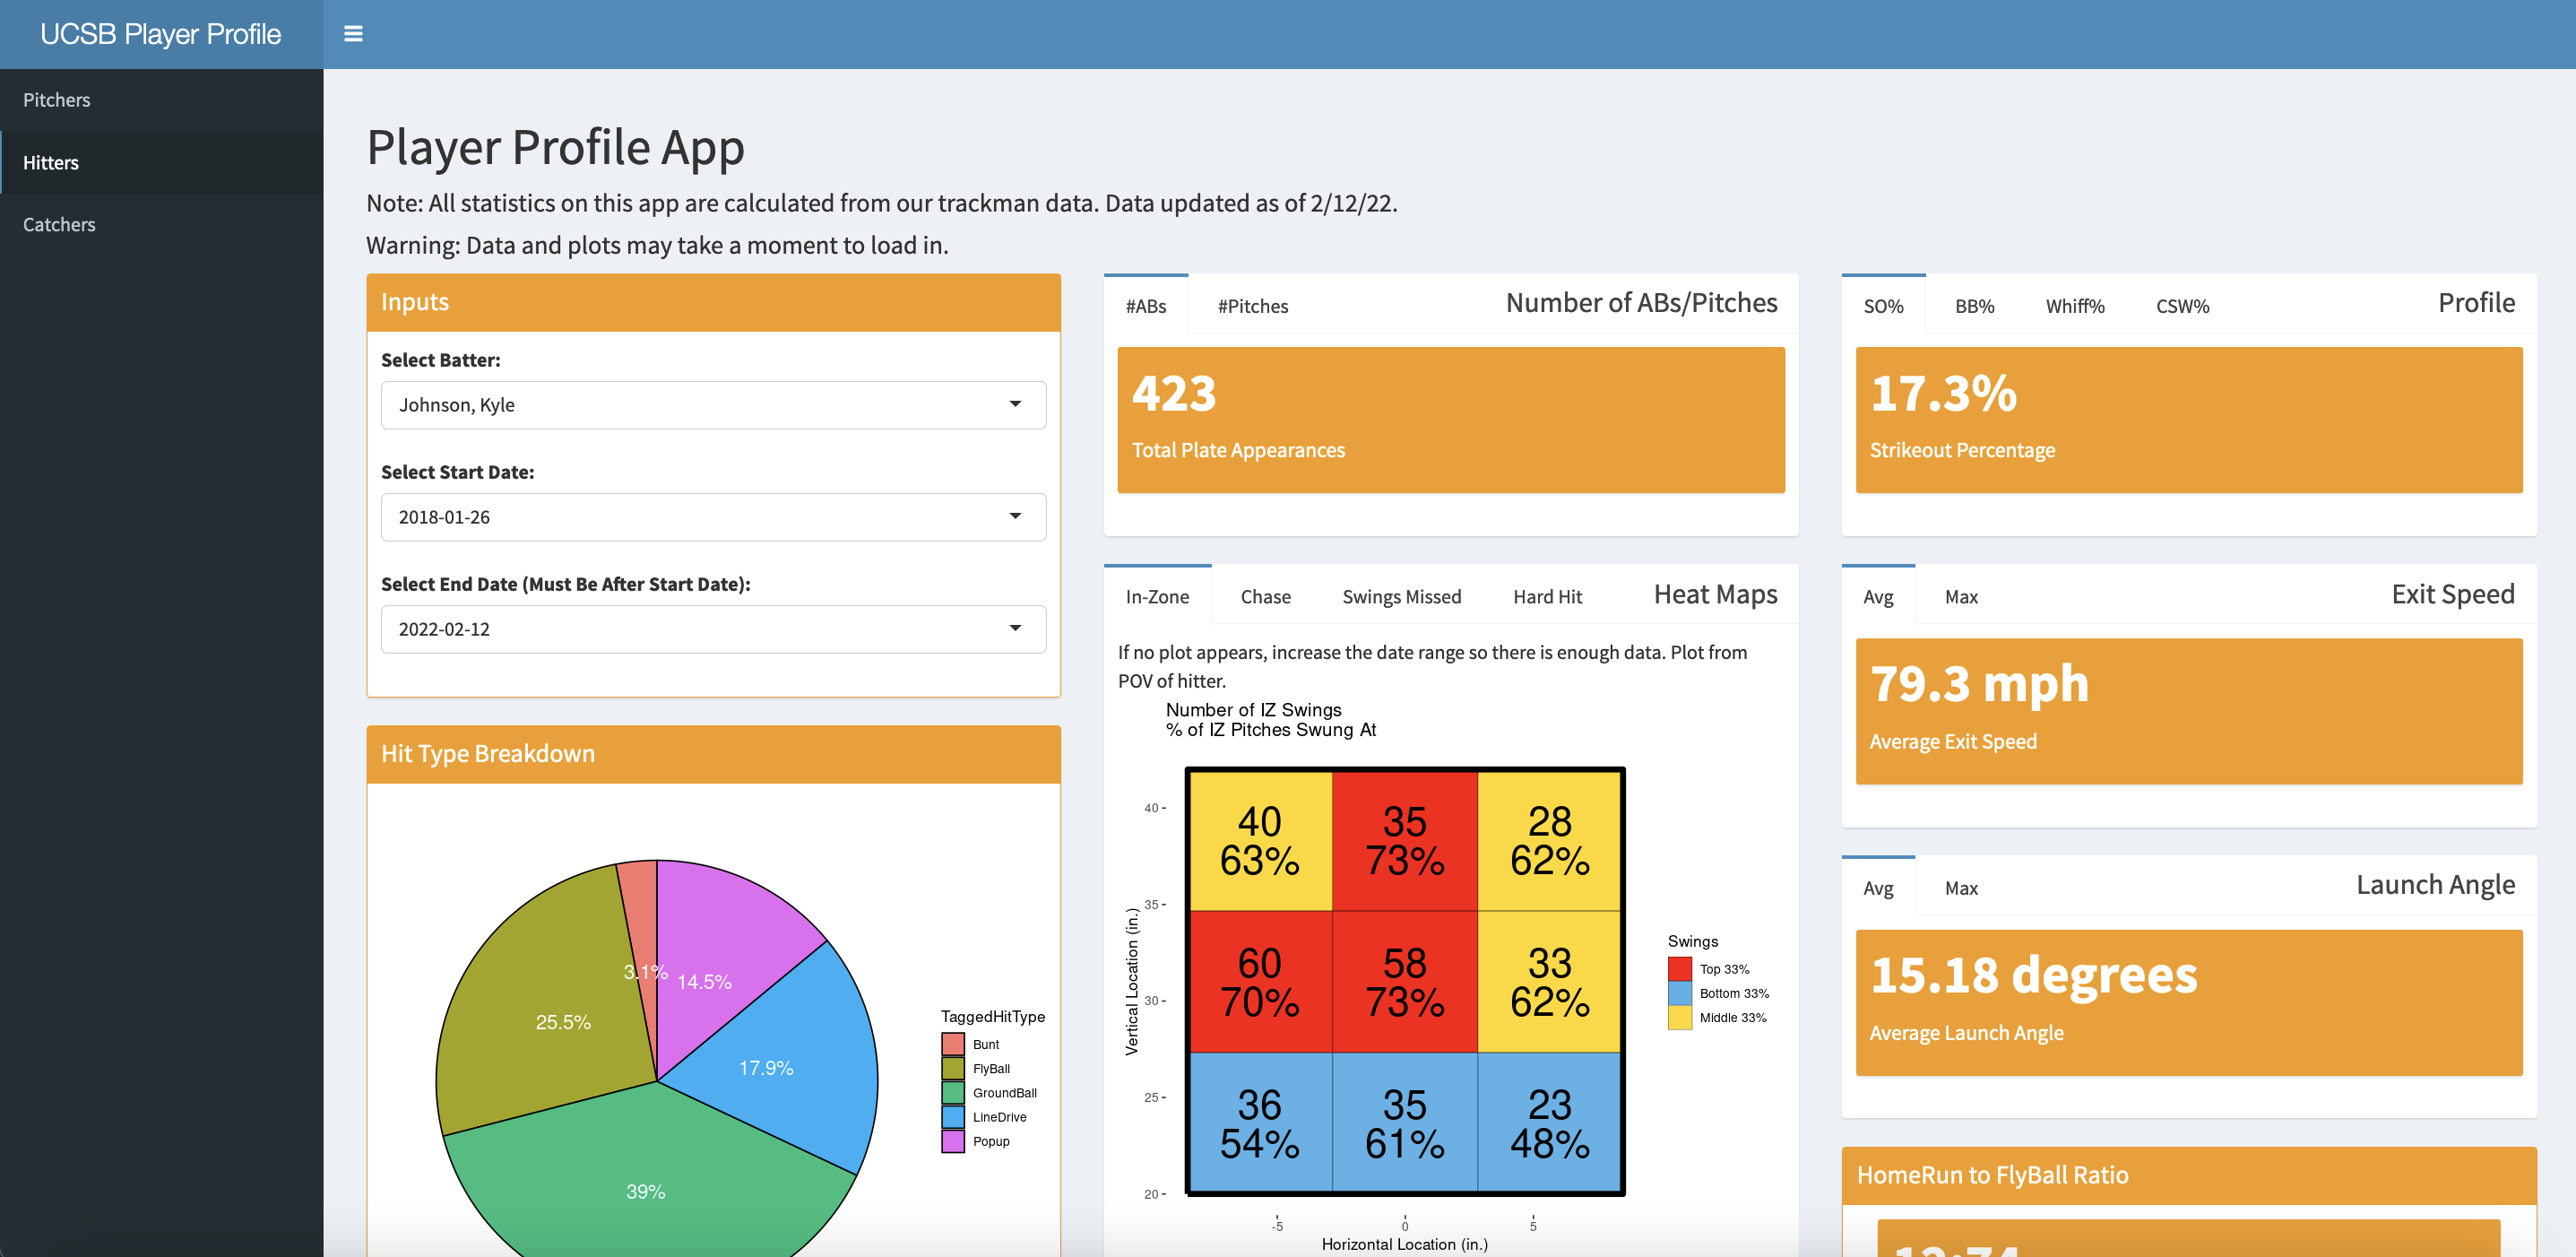
Player Profile App (Shiny Web App)
Continuing my work as a data analytics intern for UCSB's D1 baseball team, I created a player profile web application using RShiny that visualizes various statistics for each type of player on the team. Pitchers and hitters have different stats displayed as well as differing visualizations. The goal of these apps was to let the players and coaches see how well they are doing within the specified date range in comparison to the rest of the team. In addition, it serves to show how they have improved over time and what they can do to improve in the future. Warning: Plots make take a moment to load in due to the amount of data being processed. Plots look best when viewed on a laptop or desktop.
Instructions:
- On the left-hand sidebar, select the baseball position that you want to view stats on: Pitchers or Hitters
- In the "inputs" section, select the name of the player you want to see as well as a date range
- View statistics and beautiful plots
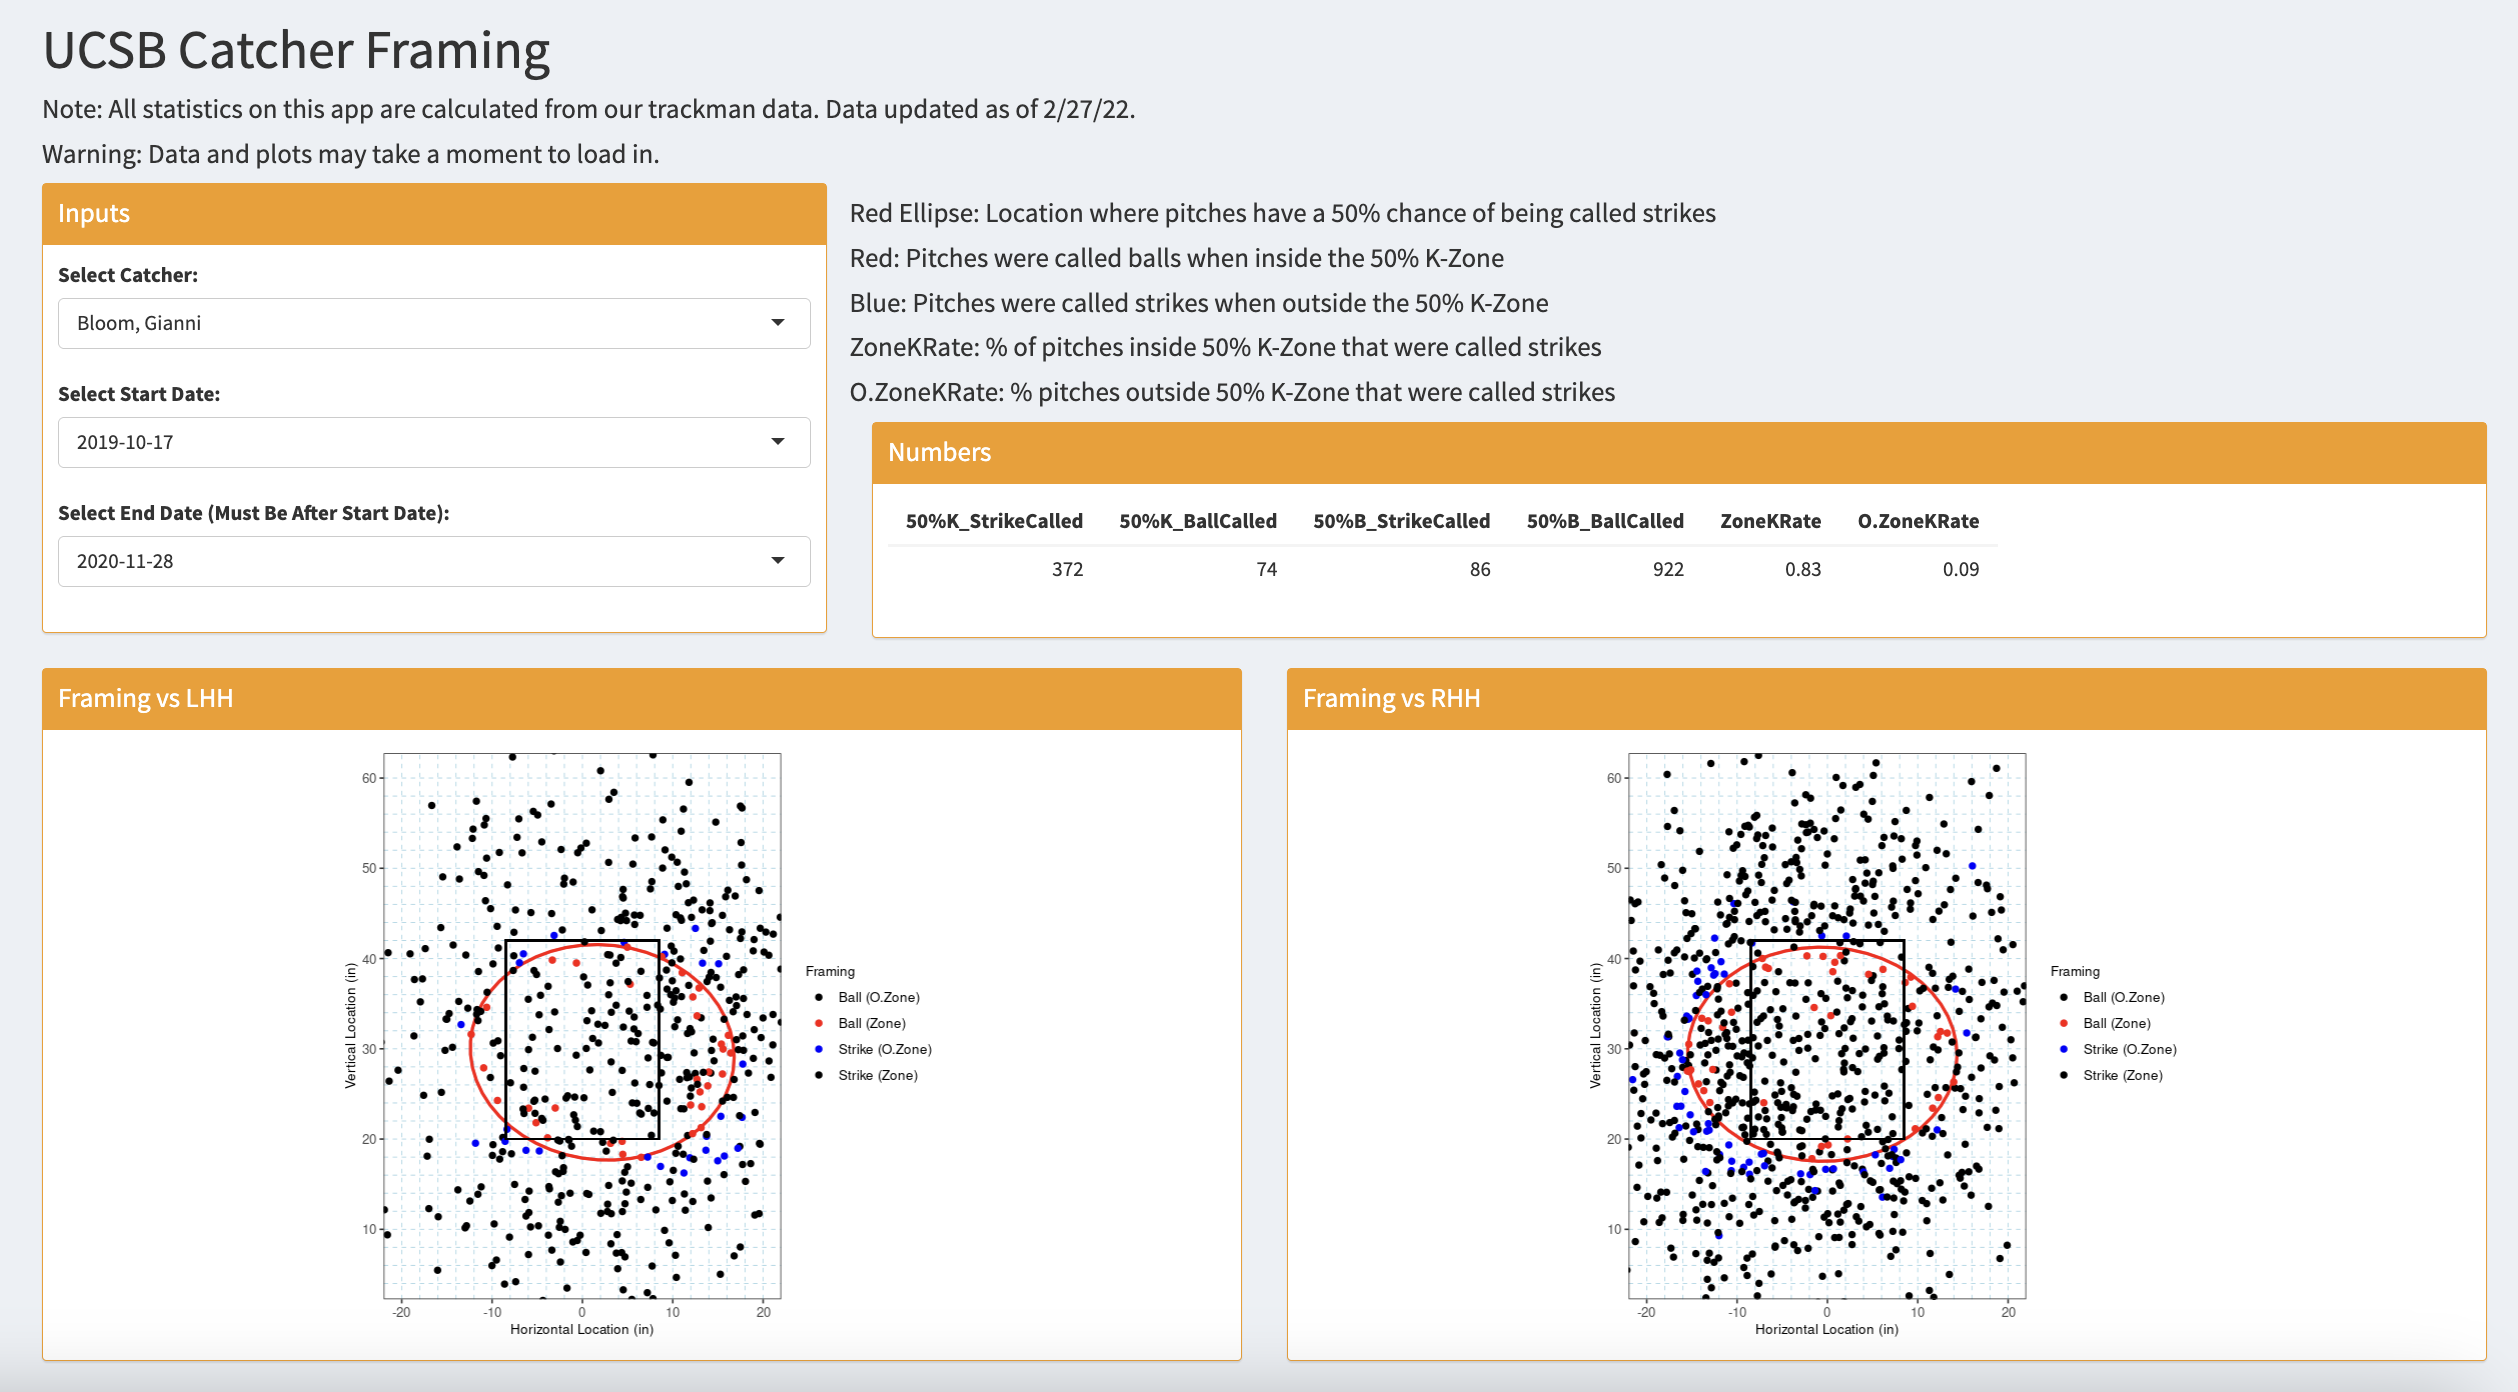
Catcher Framing App (Shiny Web App)
App for catcher framing. Warning: Plots make take a moment to load in due to the amount of data being processed. Plots look best when viewed on a laptop or desktop.
Instructions:
- In the "inputs" section, select the name of the player you want to see as well as a date range
- View statistics and beautiful plots
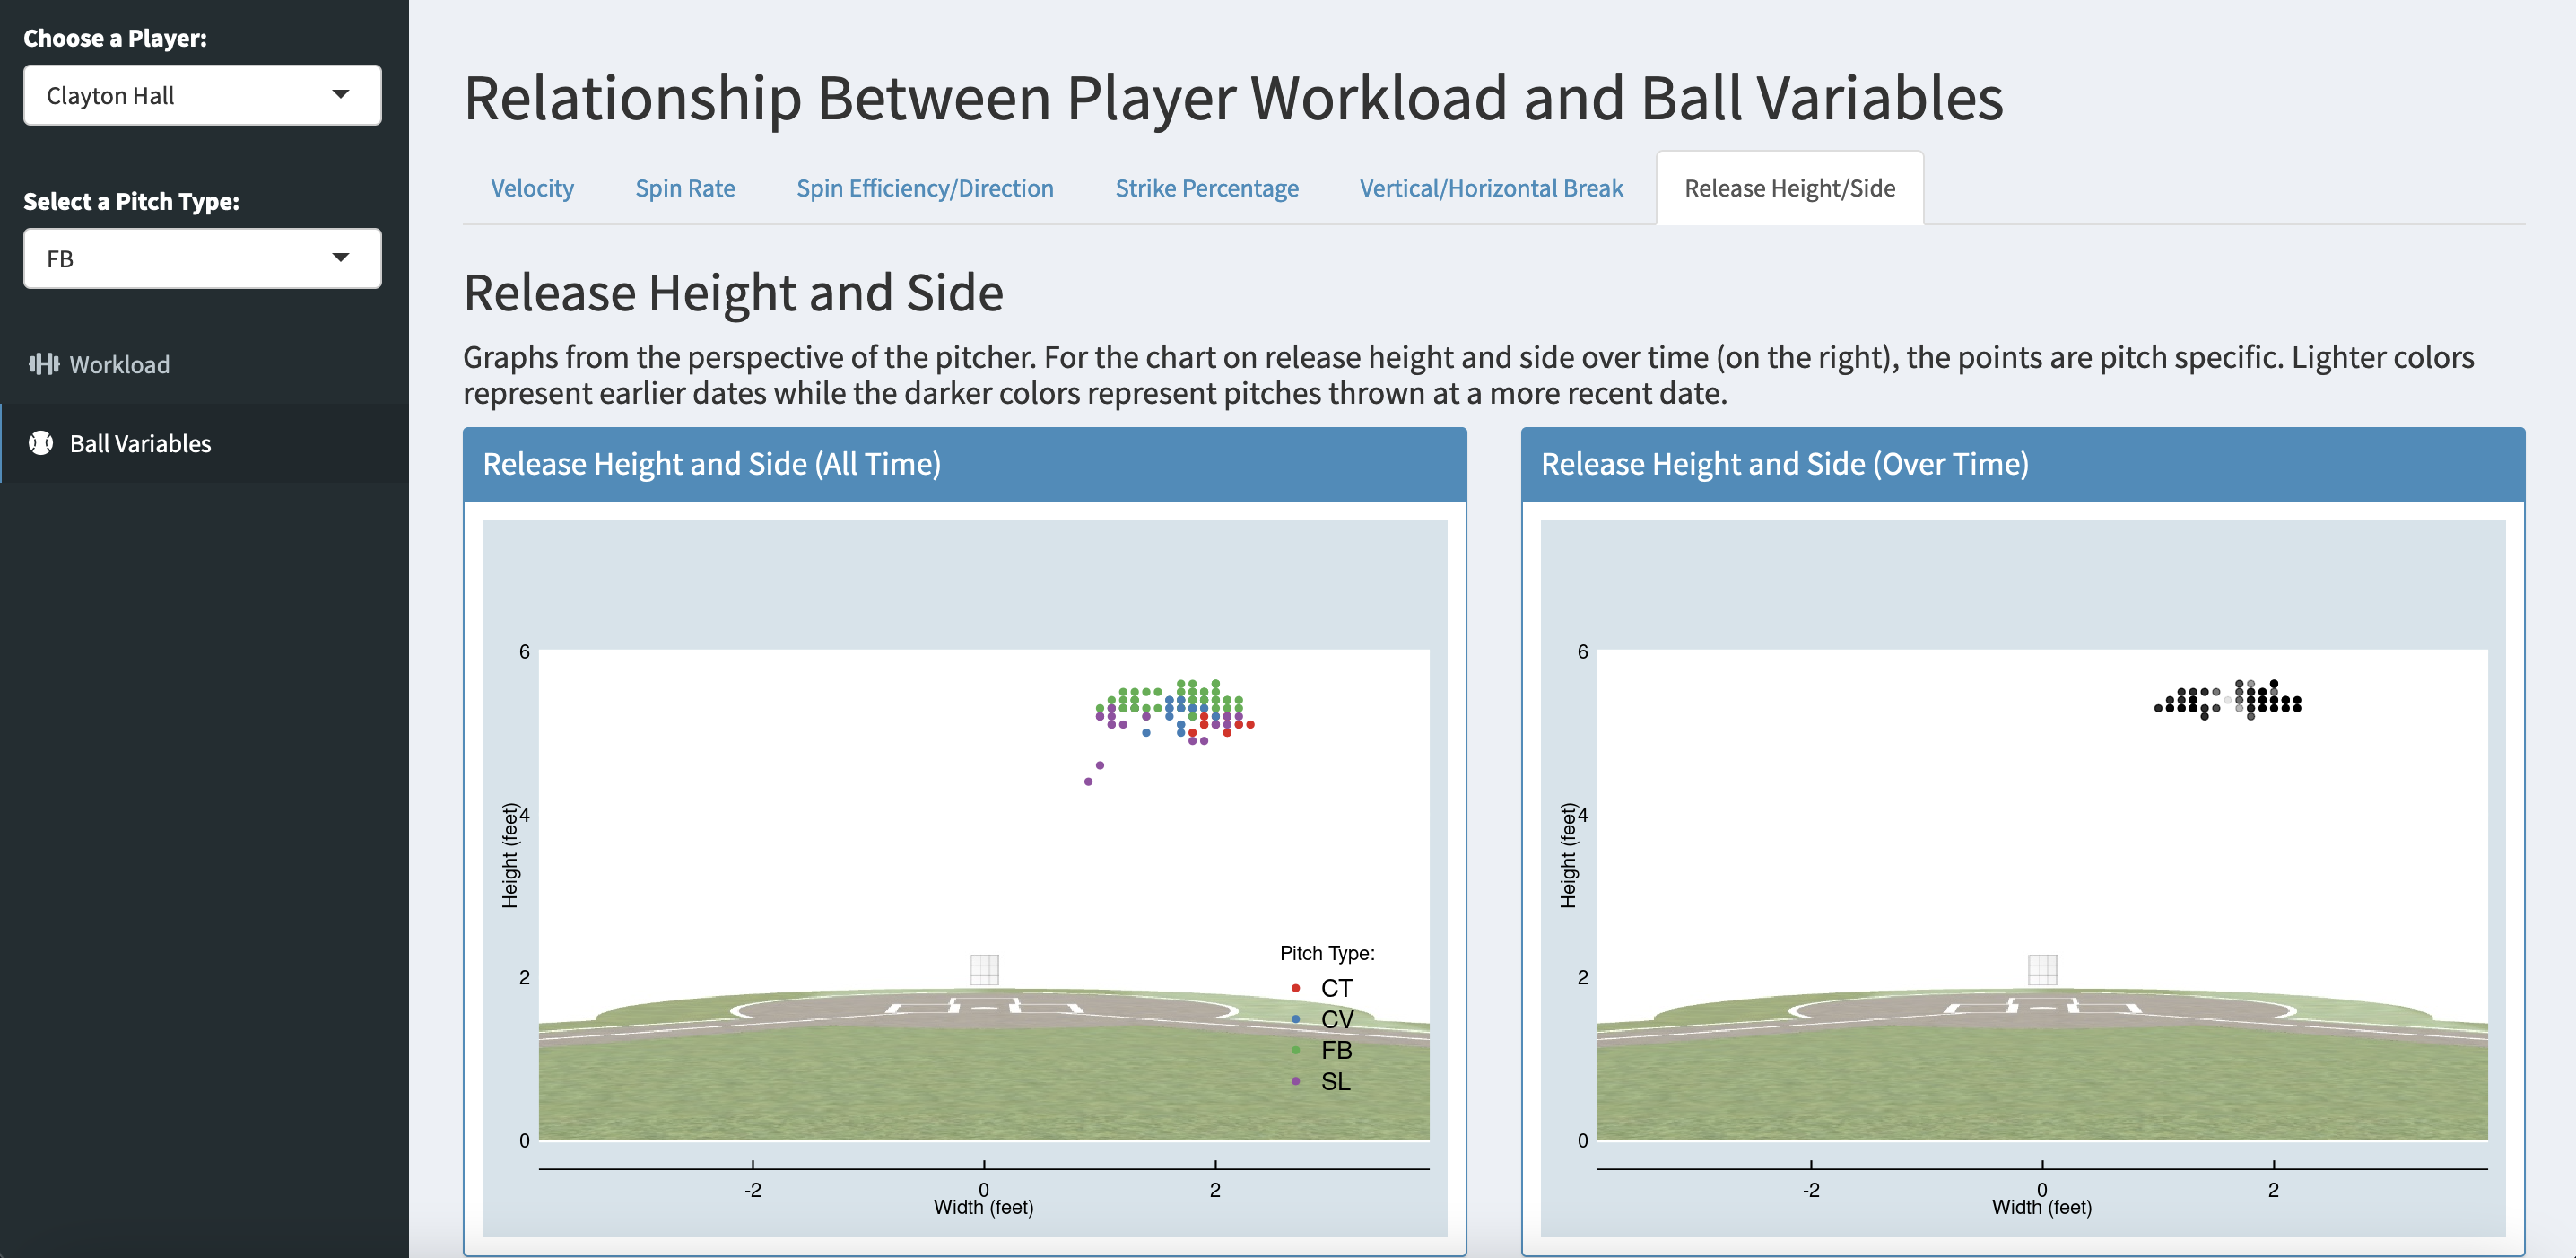
Relationship Between Pitcher Workload and Ball Variables (Shiny Web App)
During the Fall of 2021 I started a data analytics internship with UCSB's Data Analytics Team for their Division 1 Baseball Program. For Fall quarter my main project was to develop an RShiny web application that visualizes the relationship between pitcher workload and ball variable data over time. The workload data was taken through Motus while the ball variables were obtained through a machine called Trackman. Workload variables include aspects such as arm strength and mobility while ball variables include things such as velocity, spin rate, strike percentage, release position, and vertical/horizontal break.
Instructions:
- Select a pitcher from the dropdown on the left
- Select “Workload” on the left to see the pitcher’s baseline workload stats and their ranking on the team
- Then select a pitch type from the dropdown and select “Ball Variables” on the left in order to see their pitch metrics over time specific to each pitch type